Advanced Strategy: Hot & Cold Analysis for Lotto Max
Going beyond the basics. How to calculate 'Temperature Scores' and why weighted selection algorithms outperform random generation.
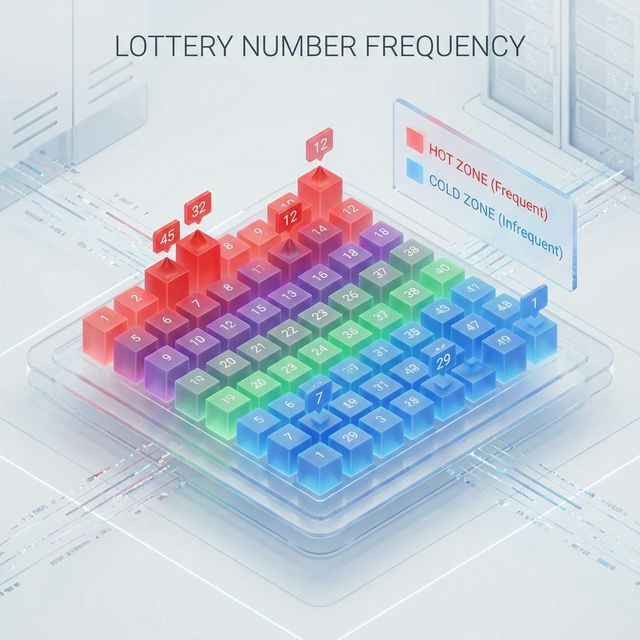
Defining "Heat" Effectively
Most players define "Hot" simply as "frequency in the last 10 draws." However, true statistical analysis requires a Weighted Moving Average. A number drawn yesterday is "hotter" than a number drawn 5 weeks ago, even if both appear once in the last 10 draws.
The Regression to the Mean
Over a sample size of 1,000 draws, distribution tends to flatten. However, in short-to-medium windows (20-50 draws), clusters occur. Our algorithm specifically targets these variance clusters. We look for numbers that are currently deviating above the standard deviation line.
Implementation Guide
Don't just pick the top 7 hot numbers. That combination has a near-zero probability. Instead, identify the Top 15 Hot Numbers and use a wheeling system (or our generator) to create combinations that pick 3-4 from this pool, while filling the rest with diverse "Cold" or "Due" numbers.
Written by The JMTech Analytics Team
Our team of software engineers and probability analysts is dedicated to providing mathematically rigorous, data-driven insights into Canadian lotteries. We analyze decades of historical draw data to separate statistical reality from gambling myths.
Data Sources: OLG • BCLC • WCLC • Loto-Quebec
Responsible Gambling Disclaimer
LottoLab is an analytical tool for informational and entertainment purposes only. We are not affiliated with OLG, BCLC, or any official lottery corporation. Lottery games are games of chance, and the odds of winning are extremely low. Past frequency data does not guarantee future results.
Ready to test these strategies?
Use our AI Generator to apply these patterns to your next ticket automatically.
Generate Numbers Now